About this Course

"Become a Data analyst with this Data analytics program. Study data cleansing, data visualization, statistical analysis, and an intro to machine learning. Utilize tools like Excel, R, PowerBI, and Tableau to work with data, using real-world datasets. After completing the course, you'll have the ability to detect patterns, trends, and make data-driven decisions. No prior coding or data analytics experience needed, suitable for all."

COURSE KEY HIGHLIGHTS

  • 45 Hrs of Instructor Led Training
  • 9 Weekend Sessions
  • Personalised Interative learning platform
  • Learn from top Industry Practitioners
  • Live Industry Projects & Case Studies
  • One-on-One with Industry Mentors
  • Designed for students, Working Professionals & Freshers
  • Resume Preparation and LinkedIn Profile Review
  • 1:1 Mock Interview
  • Placement Assistance
  • 24*7 Support
  • No Cost EMI Option

Learning objectives

  • Collect

    Collect data from several channels

  • Structure

    Clean the data and structure it

  • Analyse

    Analyse the information and classify the data

  • Explain

    Collect data from several channels

  • Decide

    Decide what is profitable with the result of the analysis..

Skills you'll gain

Data Tools
  • Excel
  • Spreadsheet
  • R Programming
  • R Markdown
  • Rstudio
  • SQL
Model
  • Data Collection
  • Data Cleansing
  • Data Analysis
  • Data Integrity
  • Data Calculations
Visualize
  • PowerBI
  • Data Visualization (DataViz)
  • Tableau Software
  • Presentation
  • Job portfolio case
Transform
  • Data Aggregation study
  • Sample Size Determination
  • Questioning
  • Decision-Making
  • Problem Solving

Course Content

1.1 Introduction, Home - Font, Alignment,Number,cells,Editing

1.2 Data - Sort, filter, Advanced filter, Data tools

1.3 Mathematical,character,date and logical functions

1.4 Lookup, Match and idex and conditional formatting

1.5 Pivot table and charts

1.6 Charts

1.7 Data visualizations

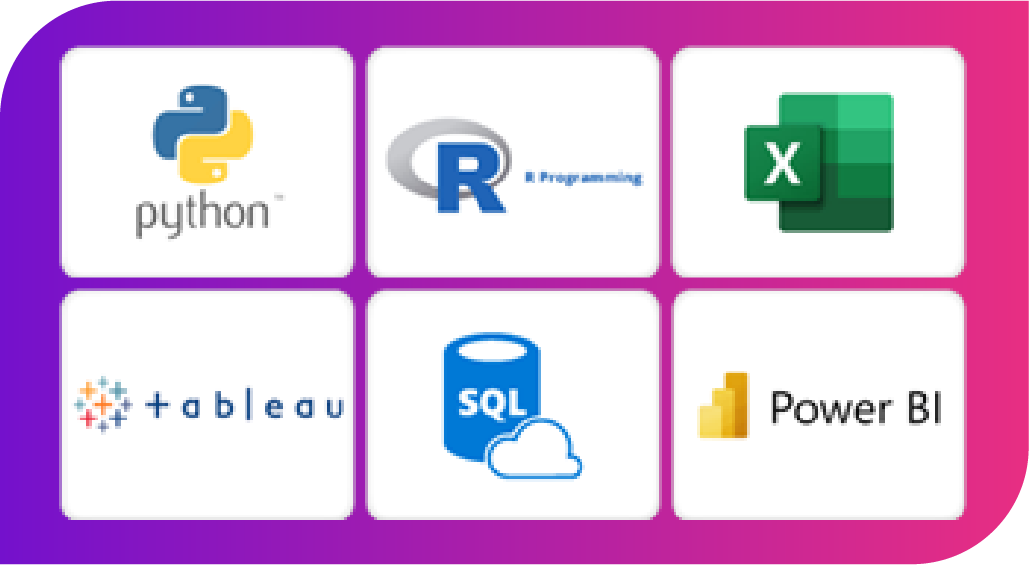
2.1 The various kinds of data types in python and its appropriate uses

2.2 Summarize data by using functions like: str(), class(), length(), nrow(), ncol()

2.3 Data Structures

2.4 Reading tabular data files

2.5 Reading from csv files

2.6 Installing packages

2.7 Pandas

2.8 Numpy

3.1 Sorting data

3.2 Merging dataframes

3.3 Data transformation

3.4 Strings and dates

3.5 Outlier detection

3.6 Handling NAs and Missing Values

3.7 Logical operations

3.8 Relational operators

3.9 Accessing Variables

3.10 Managing Subset of data

3.11 Character manipulation

3.12 Creating new variables

4.1 Understanding the Exploratory Data Analysis(EDA)

4.2 Implementation of EDA on various datasets

4.3 EDA packages

4.4 Aggregation

4.5 Computing basic statistics

5.1 Understanding on Data Visualization

5.2 Creating a bar chart, dot plot

5.3 Creating a scatter plot, pie chart

5.4 Creating a histogram and box plot

5.5 Other plotting functions

5.6 Plotting with base graphics

5.7 Plotting with Lattice graphics

5.8 Plotting and coloring

6.1 Computing basic statistics

6.2 Comparing means of two samples

6.3 Testing a correlation for significance

6.4 Hypothesis Testing

6.5 Classical tests (t,z,F), Chisquare

6.6 ANOVA

6.7 Summarizing Data

6.8 Data Munging Basics

6.9 Cross tabulation

7.1 Simple linear regression

7.2 Multiple Regression model

7.3 Logistic regression

7.4 Standardizing

8.1 Basics of SQL

8.2 Retrieving data

8.3 Data manipulation

8.4 Joins

8.5 Aggregation in SQL

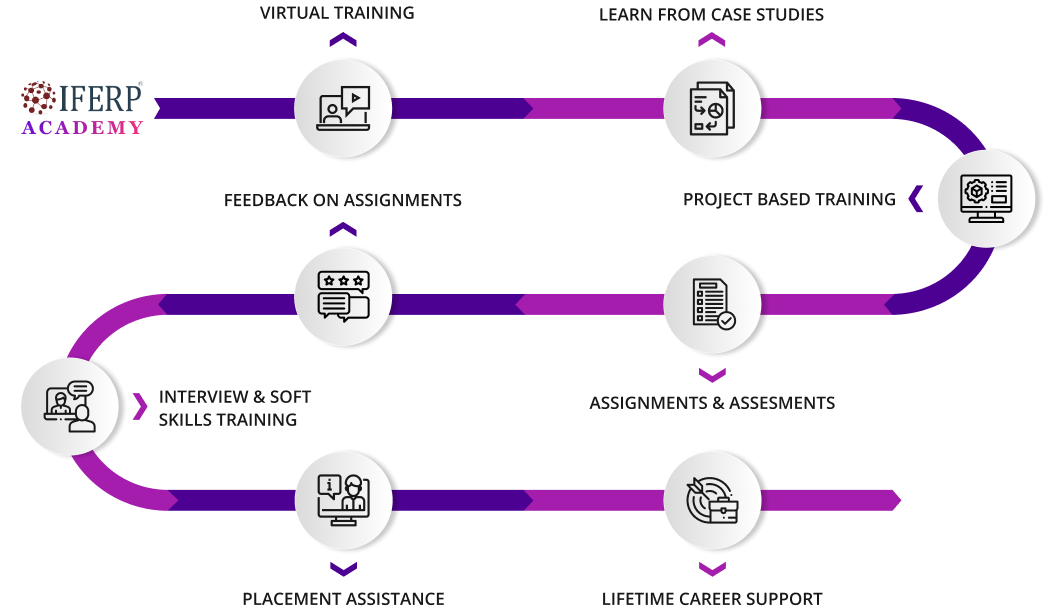
9.1 Resume & LinkedIn Profile Building

9.2 Mock Interview Preparation

9.3 1 on 1 Career Mentoring Sessions

9.4 Placement Assistance

9.5 IFERP placement drive

Common job titles

  • Data Analyst
  • Senior Data Analyst
  • Associate Data Analyst
  • Business Analyst
  • Junior Data Scientist
  • Finance Analyst
  • Operations Analyst
  • Marketing Analyst
  • Healthcare Analyst

Mentor

Adarsha Shivananda
Data Science Manager | Author | Trainer | Content Developer | Speaker | Educator - AI, ML, NLP, Deep Learning, Analytics
30 Participants

Adarsha Shivananda is a Data Science Manager working on building ML & AI capabilities for software. He aims to build a pool of exceptional DSs to solve greater problems through training programs. He previously worked at Tredence Analytics and IQVIA, and authored 6 AI books. He's a regular speaker at top colleges and serves as a mentor for AI/ML courses, plus conducts workshops & classes for aspiring DSs. He's an AI Educator, ML/AI content developer, Data Science trainer, Content creator, Analytics trainer, Corporate trainer, and a Consultant in both analytics & AI.

Tools & Technologies

Case Studies

Churn Prediction : is one of the most popular Big Data use cases in business. It consists of detecting customers who are likely to cancel a subscription to a service

HR Analytics : It mainly used to predict with which potential employee is going to leave the company

Customer Segmentation : It is the practice of dividing a customer base into groups of individuals that are similar in specific ways so companies can do marketing to each group effectively and appropriately

Campaign Measurement : Every business want to know the effectiveness of the campaign they ran and the lift in revenue because of the campaign

Recommendation Engines : Apply machine learning algorithms on broad set of data such as customer purchase data, contextual information ( device, time, third-party feedback ) to recommend products or services

Improve Customer Experience : (CX) by predicting user’s next actions and choices

Sentiment Analysis : Apply natural language processing to recognize sentiments of customer voice

Use Machine Learning to predict and alter marketers about expected business critical pivot moments ( such as churn, high valued customers, marketing leads )

  • Students

    Students from any domain such as engineering, Arts, Science & Commerce.

  • Freshers

    Great opportunity to begin your new career journey.

  • Career shift

    If you are looking for a shift analytics is a great choice.

  • Fill your career gap

    Fill your career gap in the resume with this transforming course

  • Business owners

    Start-up owners who wish to gain knowledge of analytics and to make finite decision.

  • You’re just interested

    This course is a great choice for people who want to explore and gain knowledge about analytics.

IFERP Academy Career Service

  • Webinars & Workshops
  • +
  • International Conferences
  • +
  • IFERP Project Competitions
  • +
  • Hackathons
  • +
  • Career Fair
  • Career Guidance

    Clear guidance with 1 one 1 career mentoring sessions.

  • Communication training

    We even train you with corporate communication training sessions

  • Mock Interviews

    Mock interview sessions to brush up and get you ready for the real job interviews.

  • Profile Building Assistance

    Help you build an optimized in various job portal platforms for employers to find you.

  • Resume Building

    Providing you with ideas to create a presentable and professional resume.

  • Placement Drives

    Chance to participate in IFERP’s placement drives and find jobs.

Learning Path

Refer a Friend, Get Rewarded!

Refer your friends to join our Advanced Data Analytics course and you will receive a bonus for every successful referral.

Sign up now and start referring to start earning!y

Companies Hiring Data Analytics

FAQ

  • Collects, processes, and analyzes data to identify patterns, trends, and insights.
  • Cleans and transforms data to make it suitable for analysis.
  • Uses statistical methods and data visualization to analyze data and communicate findings.
  • Creates effective data visualizations and reports to communicate insights to stakeholders.
  • Identifies and solves business problems using data analysis.
  • Join IFERP academy advanced data analytics course with a Bachelor's degree in a relevant field, such as computer science, mathematics, statistics, or data science.
  • Develop key skills in data collection, cleaning, transformation, analysis, visualization, and report writing.
  • Gain practical experience referred by IFERP academy through internships, personal projects, or entry-level positions in data-related fields.
  • Build a portfolio of your work to showcase your skills and experience to potential employers.
  • Stay current with new tools and techniques in data analysis by attending conferences, taking courses, or participating in online communities.
  • Earning a certification from IFERP academy in data analysis would add value and that demonstrate your skills and knowledge to potential employers.

Although data analysts are well-paid worldwide and exponential demand for data analysts will never decline, data analysts' salaries vary in different sectors and nations. Data analysts' salaries depend on their skills, experience, company & location. IFERP academy’s Data Analyst course helps you achieve a higher salary, expertise, and skills to succeed in this lucrative growing profession. The average annual salary in top countries is:

India: Rs. 4,90,012
US (New York): $77,730
Canada: $64,962

  • Start with the fundamentals : Learn statistics, data structures, and data manipulation techniques.
  • Learn programming languages and tools : Use languages like SQL, R, or Python, and tools like Excel, Tableau, or Power BI.
  • Work on projects : Practice by working on real-world projects, either from case studies or live projects from IFERP academy.
  • Get certified : from IFERP academy to validate your skills.
  • Attend training programs : Attend online or in-person training programs to learn from experts.
  • Join online communities : Join forums, attend webinars, and participate in online communities to learn from experts and peers.
  • Keep learning : Stay updated with new tools and techniques in data analytics by reading blogs, attending conferences, or participating in online courses through IFERP academy.

There are several reasons why you might want to consider starting a career as a Data Analyst:

  • High Demand : Data Analytics is a growing field and there is a high demand for skilled professionals in this field across various industries.
  • Lucrative Salaries : Data Analysts earn competitive salaries, with potential for salary increases over time as they gain more experience and expertise in the field.
  • Varied Career Opportunities : There are many career paths within the field of Data Analytics, such as Business Intelligence Analyst, Marketing Analyst, Financial Analyst, and more.
  • Growth Opportunities : Data Analytics is a field that is constantly evolving, with new tools and techniques being developed all the time. This means there are many opportunities for professional growth and learning.
  • Impactful Work : As a Data Analyst, you will have the opportunity to make an impact on your organization's success by using data to inform strategic decisions.

Overall, a career in Data Analytics can be challenging, rewarding, and fulfilling for those with an interest in data, technology, and problem-solving.